I've been working on a project that needs situational awareness around controlled airspace — think drone ops, low-altitude flight planning, that kind of thing. The FAA has public APIs for a lot of this data, but the documentation is scattered and the data formats require some translation before they're useful on a map. Here's a quick tour of what I connected and what came out the other end.
Airspace Boundaries
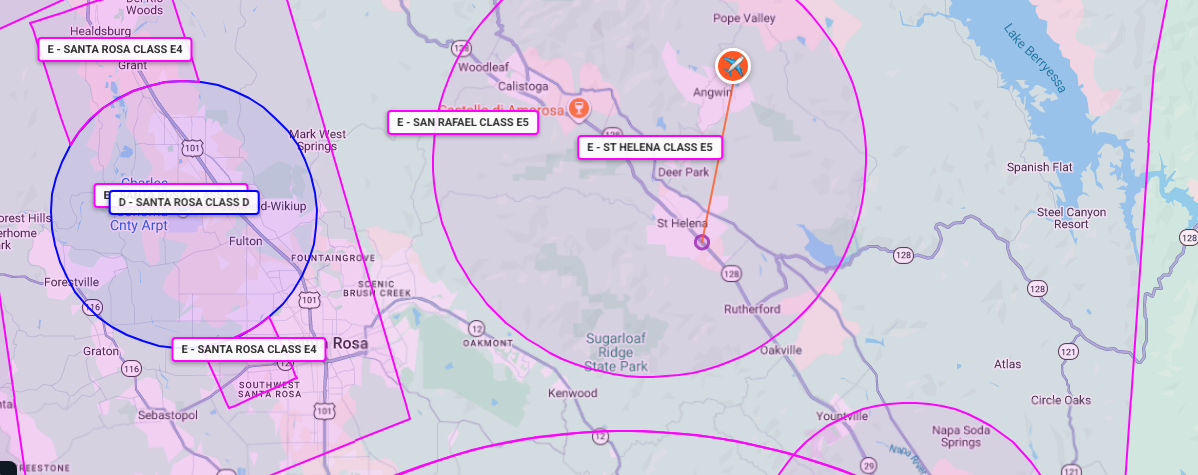
The cover image above shows airspace classifications rendered as colored overlays on a map — Class D (blue circle, the Santa Rosa airport's controlled zone) surrounded by larger Class E extensions in pink. This data comes from the FAA's aeronautical data services, which publishes airspace boundaries as GeoJSON-compatible geometry. Getting the polygons on the map is straightforward once you have the data; the interesting work is in the classification logic and deciding how to style each class so pilots (or automated systems) can read it at a glance.
Class D is the tightly controlled cylinder around towered airports. Class E is more nuanced — it extends upward and outward in shapes that don't always follow obvious logic until you understand the instrument approach procedures they're protecting. The labels in the screenshot (E4, E5) refer to surface area sub-types. More detail than most people ever need, but exactly the kind of thing you need to get right if you're building anything safety-adjacent.
METAR and TAF Data
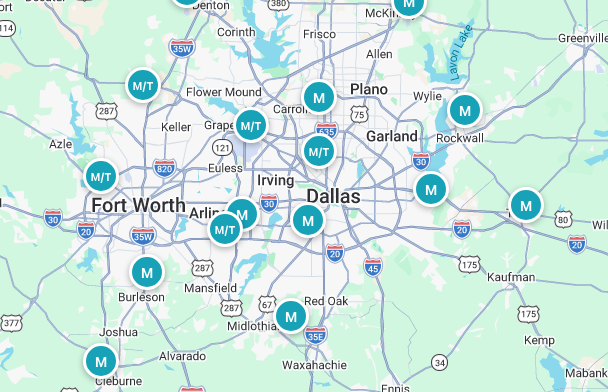
METAR stands for Meteorological Aerodrome Report — it's the standardized format aviation weather has used for decades. TAF (Terminal Aerodrome Forecast) is the corresponding forecast, issued at larger airports. Both are available in near-real-time from aviationweather.gov, which has a clean REST API that returns either raw encoded strings or decoded JSON.
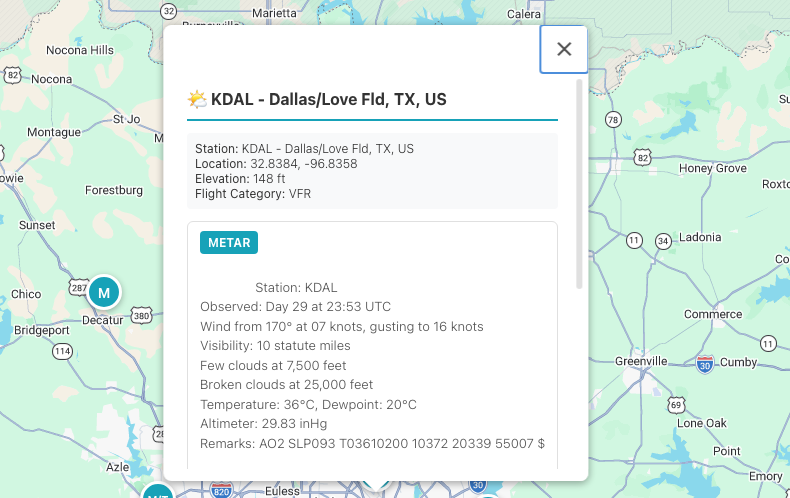
The popup above shows a decoded METAR for KDAL (Dallas Love Field). Wind direction and speed, visibility, cloud layers with altitudes, temperature and dewpoint, altimeter setting — the raw METAR string at the bottom encodes all of this in a compact format that looks like noise until you know how to read it. The API handles the decoding; the UI just needs to present it clearly. Flight category (VFR, MVFR, IFR, LIFR) is derived from visibility and ceiling and is useful for quick status coloring on the map.
NOTAMs
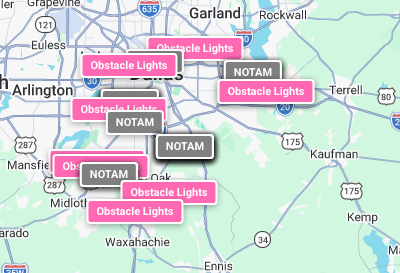
NOTAMs (Notices to Air Missions) are temporary notices about anything that could affect flight — runway closures, crane operations, airshows, GPS outages, parachute activity, laser testing. They're chaotic by nature because they cover an enormous range of situations with varying geographic scope and time windows.
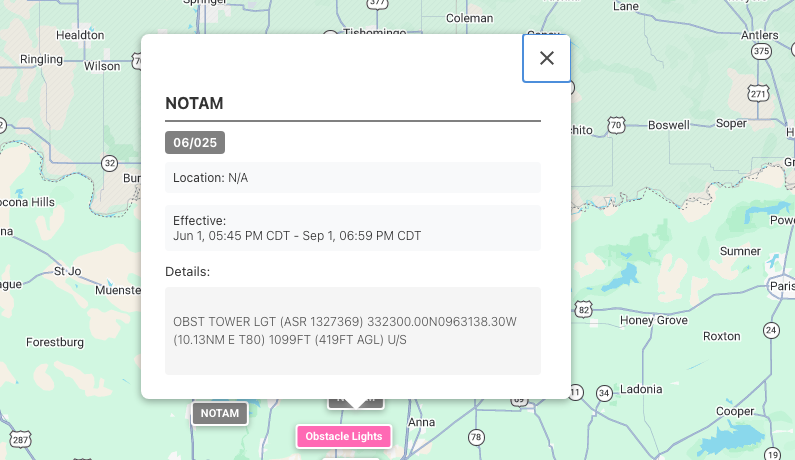
The FAA's NOTAM API returns structured data including location coordinates (when available), effective time windows, and the raw NOTAM text. The example above is an obstacle tower lighting notice — a 419-foot tower with its light active from June through September. Straightforward once decoded, but the raw format (OBST TOWER LGT (ASR 1327369) 332300.00N0963138.30W) requires parsing to extract coordinates and classify the notice type.
The trickier NOTAMs have no specific coordinates — they reference a location by identifier or describe a broad area — so plotting them accurately requires some fallback logic. I ended up clustering those at the referenced airport or facility when a point location wasn't available.
What I'd Do With This
On its own, a map with airspace, weather, and NOTAMs is a useful situational awareness tool. The more interesting layer is programmatic: given a planned route and a time window, automatically flag which airspaces require authorization, pull current weather along the path, and surface any active NOTAMs that intersect the route. That's the direction this is heading — turning raw FAA data into actionable pre-flight intelligence rather than just another map to stare at.
The APIs are well-behaved and mostly free for reasonable use. If you're building anything in the drone, air taxi, or general aviation space, it's worth knowing they exist.